The dataset used for this project contains detailed logs of matches from the mobile game Brawl Stars, developed by Supercell. The data provides valuable insights into gameplay mechanics, player behavior, and match outcomes.
2.1.2 Key Information:
Source: The dataset was obtained from Kaggle, where it was shared in JSON format.
Format: Our preprocessed dataset is in CSV format, with 40+ columns capturing details about players, brawlers, match outcomes, and game modes.
Size: 100,000+ rows, with each row reflecting a different match.
Preprocessing:
JSON data was restructured into CSV format.
Null values and inconsistent entries were identified for cleanup.
2.1.3 Challenges:
We are also pursuing gathering our own data via API, but gathering such a sizeable dataset is challenging since real player IDs must be individually specified, unless we access player IDs via the top rankings table, in which case, the data will be heavily skewed towards high skilled, high trophy game play which is different from how many/most players play.
In the current dataset, we are facing the following challenges:
Outdated Data:
The dataset reflects an older version of Brawl Stars (updated July 2021). For instance:
Brawler levels max out at 10 (current cap is 11).
Certain battle modes, such as type, are ambiguous and undefined; the official “ranked” mode was released earlier this year (2024), however, the 2021 data cites ranked versus casual play in type.
Ambiguities in Game Modes:
Some modes, like type do not translate directly to known categories and may be excluded from mode-specific analysis.
2.1.4 Summary of Columns:
Our dataset has detailed logs of matches, including:
Player & brawler information
Names & IDs of players across all teams
Brawler levels
Star player details
Battle information
Event IDs
Map information
Match duration
Trophy changes
2.2 Missing Value Analysis
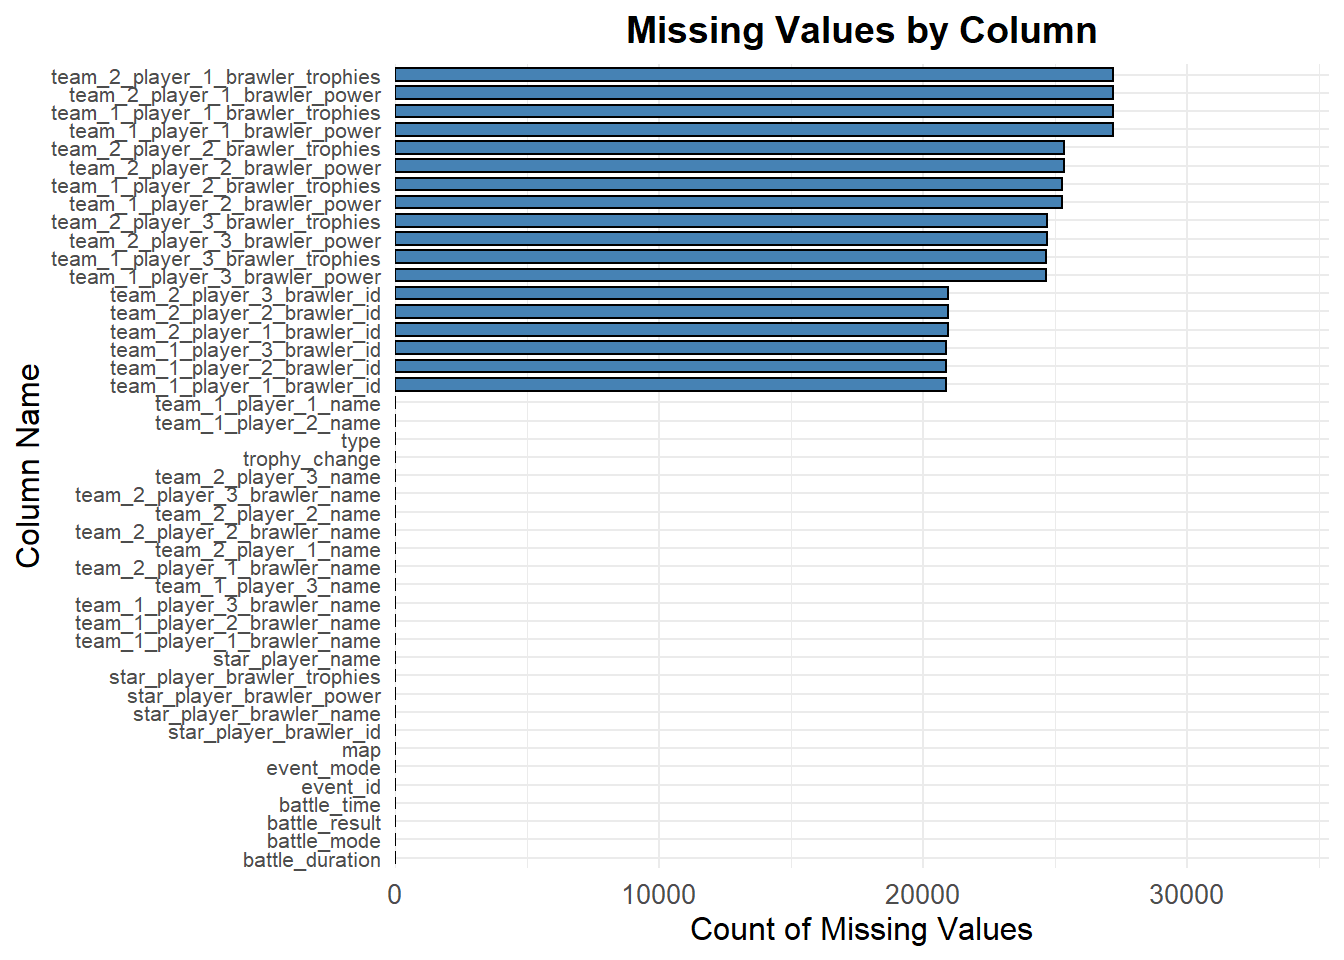
2.2.1 Missing Values by Column
Code
# load necessary librarieslibrary(ggplot2)suppressPackageStartupMessages(library(dplyr))library(tidyr)data<-read.csv("battles_data_full.csv")# calculate missing values for each columnmissing_values <- data |>summarise(across(everything(), ~sum(is.na(.)))) |>pivot_longer(cols =everything(), names_to ='column', values_to ='missing_count')# visualize missing values with improved label handlingggplot(missing_values, aes(x =reorder(column, missing_count), y = missing_count)) +geom_bar(stat ='identity', fill ='steelblue', color ='black', width =0.7) +coord_flip() +scale_y_continuous(expand =expansion(mult =c(0, 0.3))) +# add a small space above bars labs(title ='Missing Values by Column', x ='Column Name', y ='Count of Missing Values') +theme_minimal() +theme(plot.title =element_text(hjust =0.5, size =14, face ='bold'), axis.text.y =element_text(size =8, angle =0, hjust =1), axis.text.x =element_text(size =10), axis.title =element_text(size =12))
Code
# filter null power levelsnull_power_levels <- data |>filter(is.na(team_1_player_1_brawler_power)) |>count(battle_mode)# plot null power levels across battle modesggplot(null_power_levels, aes(x =reorder(battle_mode, -n), y = n)) +geom_bar(stat ="identity", fill ="orange", color ="black", width =0.7) +labs(title ="Frequency of Null Power Levels by Battle Mode", x ="Battle Mode", y ="Count of Null Power Levels") +theme_minimal() +theme(plot.title =element_text(hjust =0.5, size =14, face ="bold"), axis.text.x =element_text(size =10, angle =45, hjust =1), axis.title =element_text(size =12))
Null and Missing Values:
- Some rows have missing player names or brawler details.
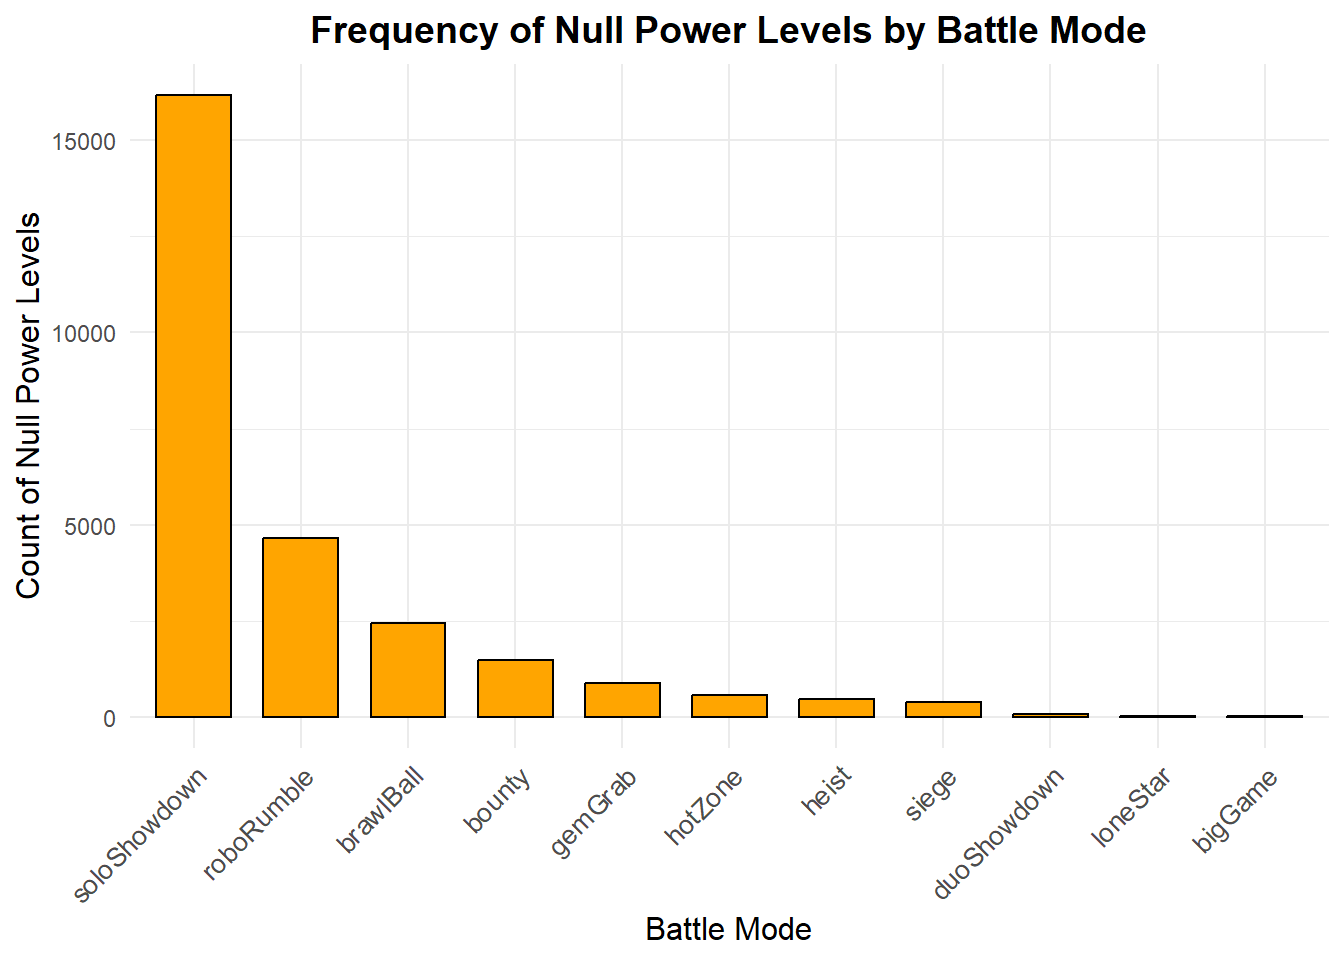
- ‘power_level’ usually should never be null, since all brawlers have a power level between 1 and 11 (10 in the data), however, there are many null power levels in the data.
- In most game modes, there are three brawlers per team, and the data contains the ‘power_level’ for each brawler. However, soloShowdown and duoShowdown only have 1 and 2 brawlers per team respectively, so it is expected for those modes to have more null values.
- Similarly, undefined values in ‘battle_mode’ and ‘battle_result’ raise questions about data quality.
2.2.2 d3 Code Preparation
Code that we used to create the dataset needed for the d3 visualization: